Australia
 Austia
 Belgium
 Bulgaria
 Canada
 China
China Croatia
 Cyprus
 Czech Republic
 Denmark
 Estonia
 Finland
 France
 Germany
 Greece
 Hong Kong
 Hungary
 Ireland
 Italy
Italy Latvia
 Lithuania
 Liechtenstein
 Luxembourg
 Malta
Malta Mexico
 The Netherlands
 New Zealand
 Norway
 Poland
 Portugal
 Romania
 Singapore
 Slovakia
 Slovenia
 South Africa
 Spain
Spain Sweden
 United Kingdom
 United Arab Emirates
 United States and Rest of the World
Overcoming Exercise-Induced Asthma as a competitive cyclist
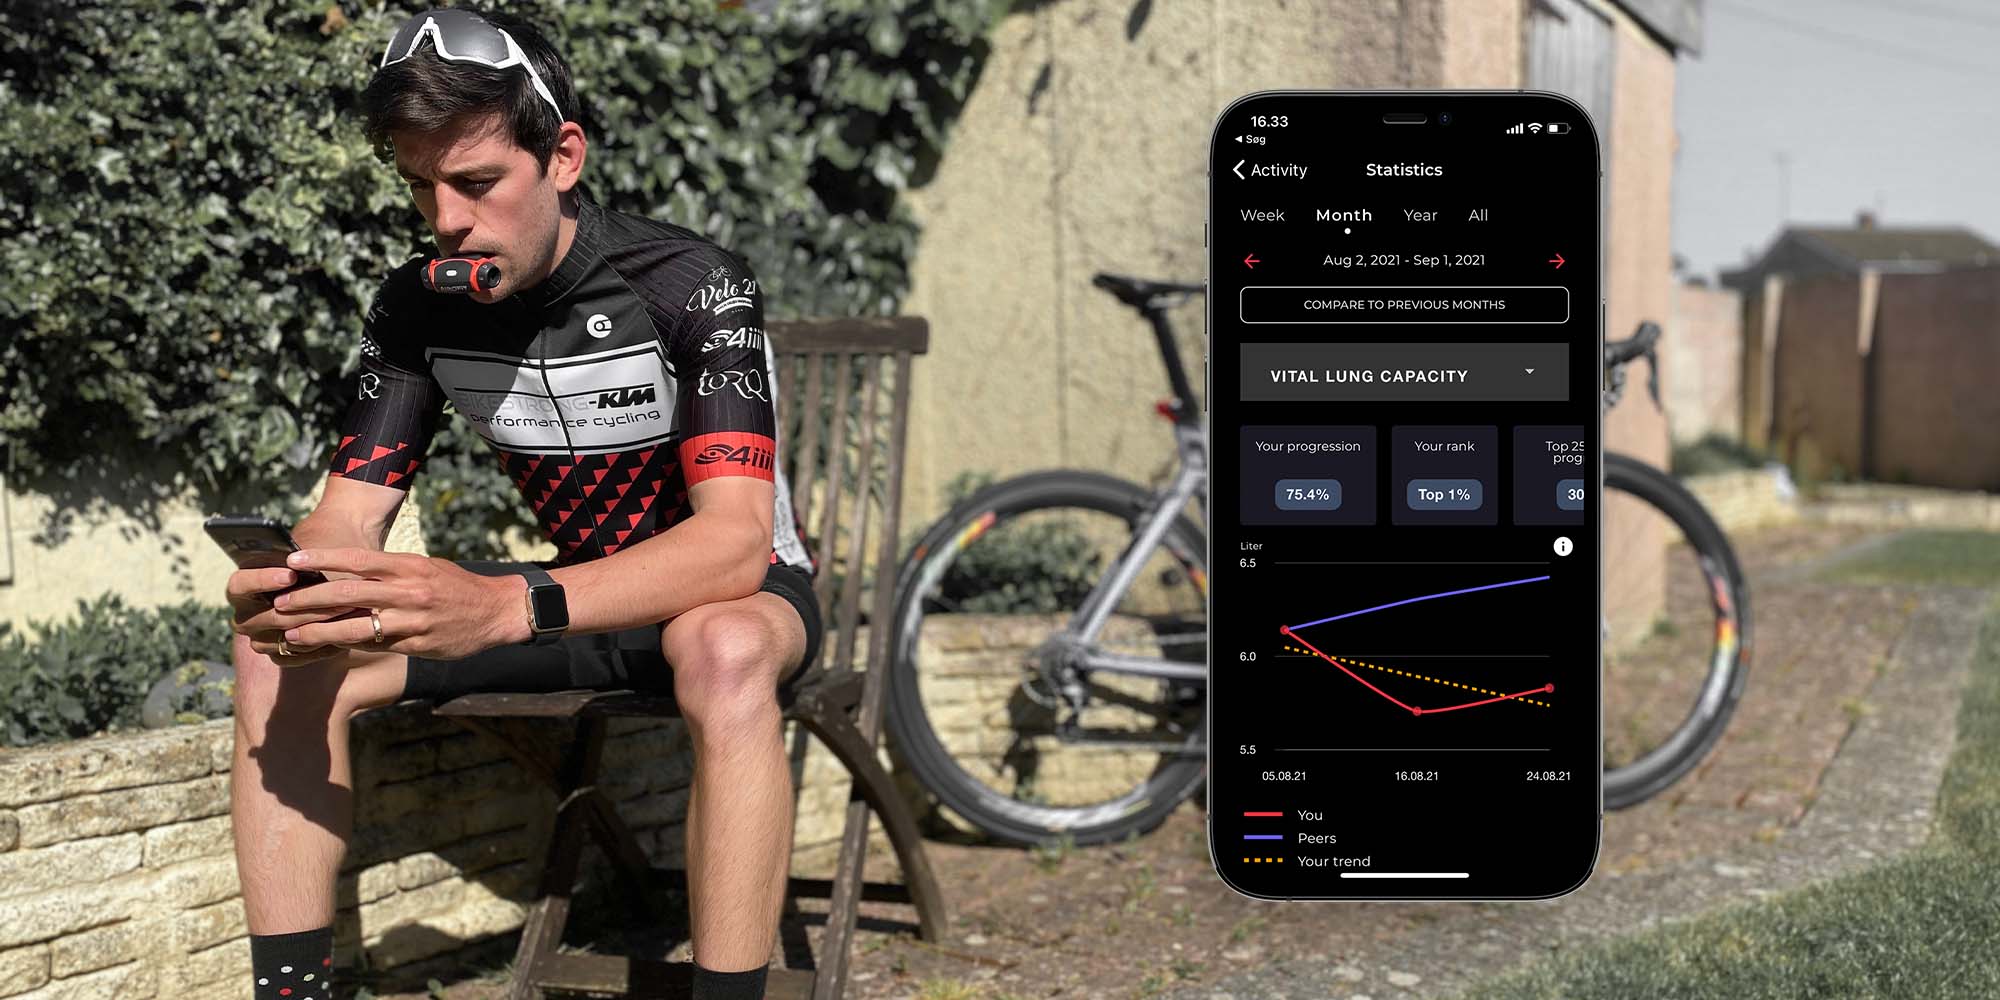
This case study has been done by Alex Wallace – a competitive cyclist for Bikestrong-KTM.
The prevalence of Exercise-Induced Asthma in endurance athletes is very common. This is due to a range of factors, such as the higher ventilation rates which are generally sustained for long periods of time, mouth breathing and environmental factors such as compromised air quality and low temperatures.
During exercise, each one of these contributing factors can provoke the following asthmatic symptoms:
- Shortness of breath
- Tightness in the chest
- Coughing
- Wheezing
- Decrease in performance
This case study discusses the respiratory and performance adaptations made as a result of regular breathing training, using an Airofit PRO breathing trainer – twice daily. As a competitive road cyclist diagnosed to have Exercise-Induced Asthma, I used myself as a subject to monitor any progress over a 12-week period, regularly testing via various means such as Peak Flow testing, Airofit in app test scores, power data and heart rate data.
Test subject background
27-year-old male, with an athletic, multi-sport background from a young age. Previous 2 years have consisted of road cycling, training 6-7 days a week, generally 8-12 hours in total, including regular criterium and road racing. Working full time, Monday to Friday. Living with a wife and new-born child.
Diagnosed with Exercise-Induced Asthma in August 2019, following experiencing inspiratory limitations during high intensity intervals and long duration maximal efforts whilst cycling. Prior to the beginning of the trial period 1 dose of Fostair 100/6 Inhaler (100 micrograms of beclometasone dipropionate and 6 micrograms of formoterol fumarate dihydrate) was taken twice daily, once in the morning and once at night. At both points the dose was taken after any breathing training and testing was carried out. Fostair 100/6 was discontinued after week 4 of the trial period. Salamol Easi-Breathe CFC-Free Inhaler was also prescribed, this was accessible during all training sessions as a precaution, but not used at any point.
12 week programming
Cycling Training: A pre-planned structured training program was implemented for the 12-week test period, consisting of periodized training sessions and scheduled testing. It was important however that this program was not overly dissimilar to any previous training undertaken, so as to ensure that the data gathered would be comparable when analysing and comparing progression rates with past data.
Breathing Training: Following on from the completion of the cycling training program, Airofit developed a bespoke breathing training program. This was specifically designed to complement the cycling program, whilst gradually increasing both the time and difficulty of the session’s week by week – ranging from 5 minutes per session with a difficulty level of ‘easy’ to 10 minutes at ‘expert’.
Testing methods
Peak Flow Testing:
Peak flow measurement is a quick test which is performed by forcibly exhaling into a small tube-like device, providing a score from 0 to 900. The device used for the full duration of test period was a Wrights Mini Peak Flow Meter. This device provides a reading, which is taken in order to measure air flowing out of the lungs. The measurement is also called the peak expiratory flow rate (PEFR) or the peak expiratory flow (PEF).
By measuring how fast you’re able to breathe out, your peak flow score can indicate whether your airways are narrowed. As such this is a commonly used testing method to both diagnose and monitor asthma. Typical indicators include low and / or inconsistent scores.
This test was performed twice a day though out the entire 12-week test period, once first thing in the morning and once at the end of the day. In order to determine an accurate score, the highest score from 3 separate exhalations was recorded. The test was always taken prior to any breathing training, the data was then recorded using a smartphone app.
Airofit in App Testing:
This is a quick and easy test which is carried out using an Airofit breathing trainer, all scores and data are displayed and recorded via the Airofit app. In order to perform this test the individual must completely exhale all of the air from their lungs, before then inhaling with maximum power, followed by a maximal exhalation until the lungs are again completely empty.
This test takes three separate readings: accessible vital lung capacity, maximal inspiratory pressure and maximal expiratory pressure.
The test was initially carried out every 2 to 3 days, however following the identification of the accuracy and value of the data, this protocol was then amended to be performed twice daily. The test was typically taken around 5 minutes after the Peak Flow test, prior to any breathing training.
Power Data:
Recorded using Garmin Vector 3 power meter pedals or a Wahoo Kickr Smart turbo trainer. Providing comparable power data recorded in watts, resulting in an accurate method of monitoring and testing performance. This is also used to set specific cycling training sessions, for example 40 minutes at 280-300 watts.
Heart Rate Data:
Recorded using a MyZone MZ3 chest strap heart rate monitor. This monitor was worn for the duration of each training session and provides data which can be useful in conjunction with power data. It is also a useful tool used to identify any signs of overreaching / overtraining.
Personal Observations (Feel):
Notes were regularly recorded throughout the test period with regards to how each training session or test felt. This was recorded in two ways, a perceived level of exertion, scored from 1 to 10 and written observations – primarily related to any breathing observations.
Observations & Results
1. Peak Flow results
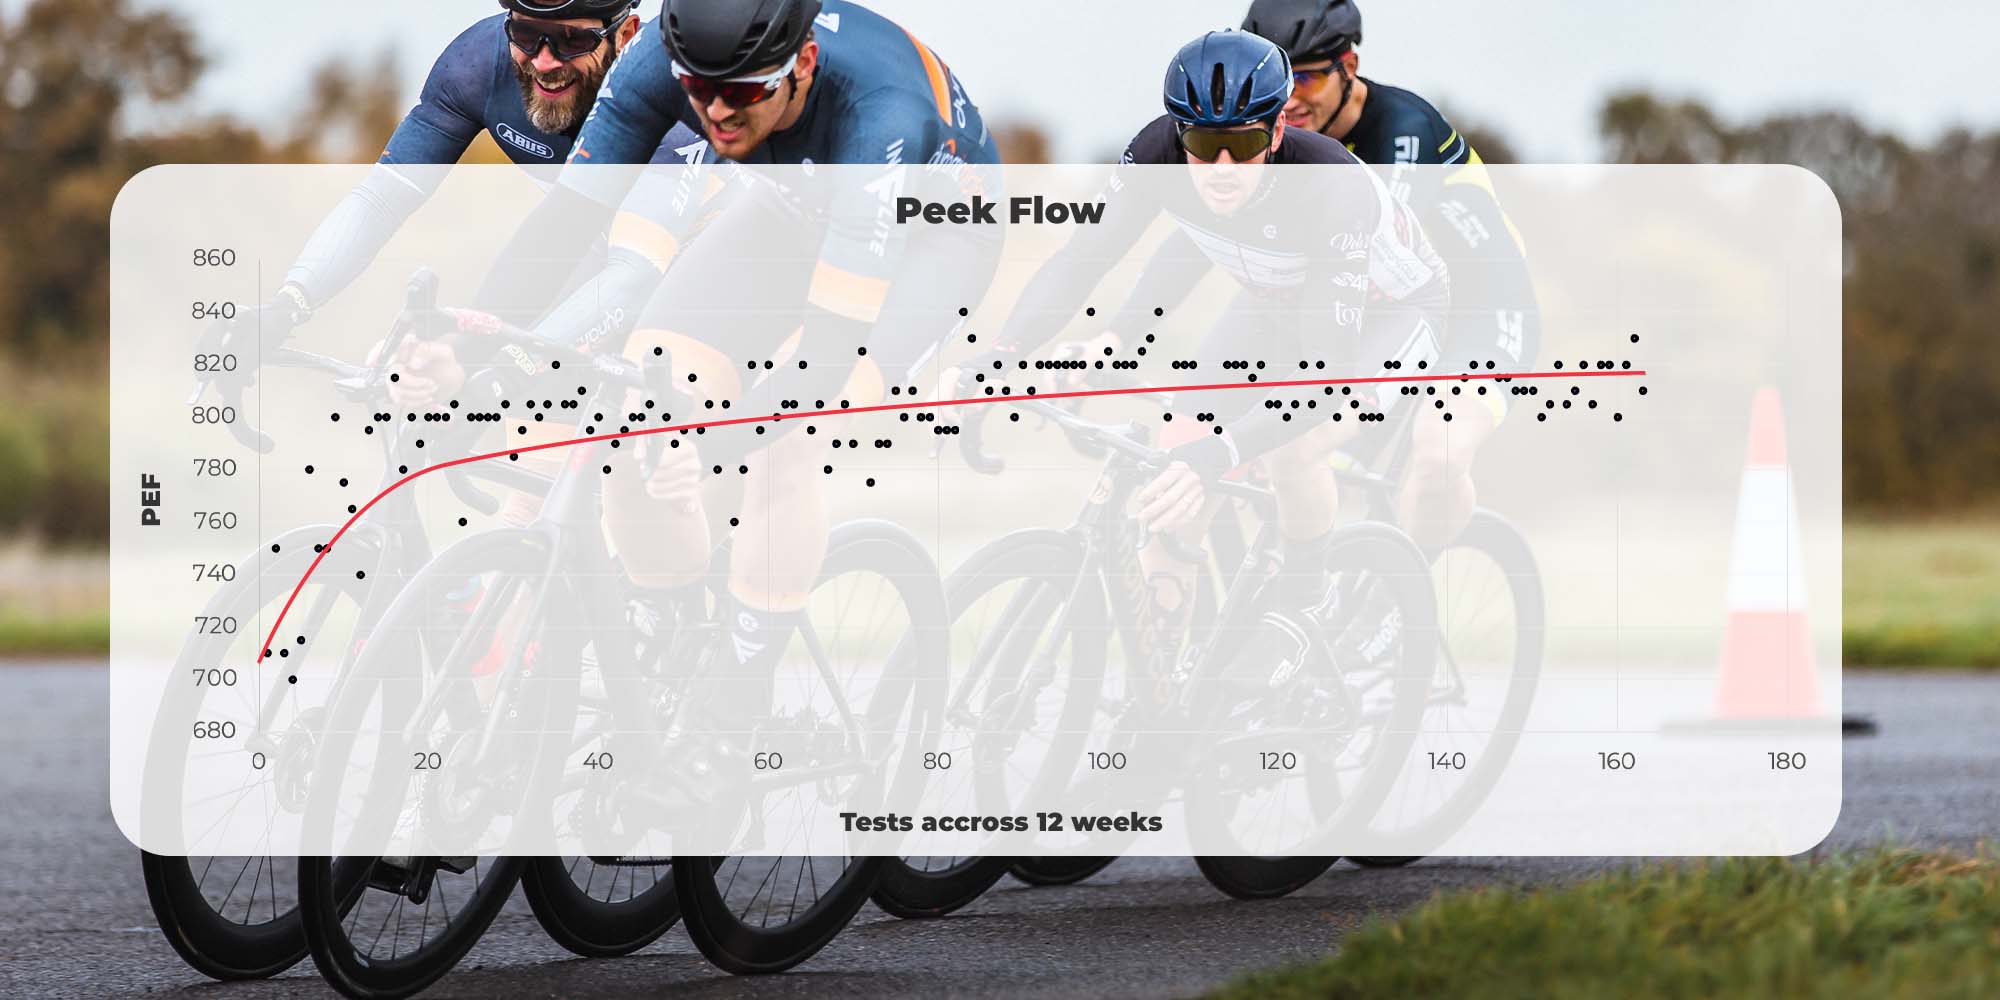
Improvement in these test scores can clearly be observed within both the 12-week test period and by comparing these scores to the data recorded prior to the test period, in order to initially identify Exercise-Induced Asthma.
Below is a breakdown of the key data, recorded during the first and last quarter of the test period.
First 3-week period:
Week 1 – The trial showed scores which varied from 700 to 800, with an overall variation score of 15.2%.
Week 2 – By this point score range had already increased to 760 to 815, with an overall variation score of 7% – less than half that of the first week.
Week 3 – Test scores ranged from 780 to 820, with an overall variation score of 5% – two thirds lower than the first week.
Final 3-week period:
Week 10 – Scores ranged from 800 to 820, with an overall variation of just 2.5%.
Week 11 & 12 – Scores replicated the consistency from week 10 ranging from 800 to 820, with a variation score of 2.5%.
The highest scores recorded during the test period was 840, recorded during weeks 7 and 8, this could have potentially been due to a positive response to both forms of training at that point, before the volume and intensity increased in the final third of the trial. They may however simply be outliers, produced as a consequence of variable conditions. The lowest score was 700, this was produced in week 1.
The data recorded in the initial identification phase prior to the test period was similar to scores recorded through the earlier stages of week 1, confirming that this is a fair and accurate staring point from which to reference any improvements from.
2. Airofit in-app results
Accessible Vital Lung Capacity
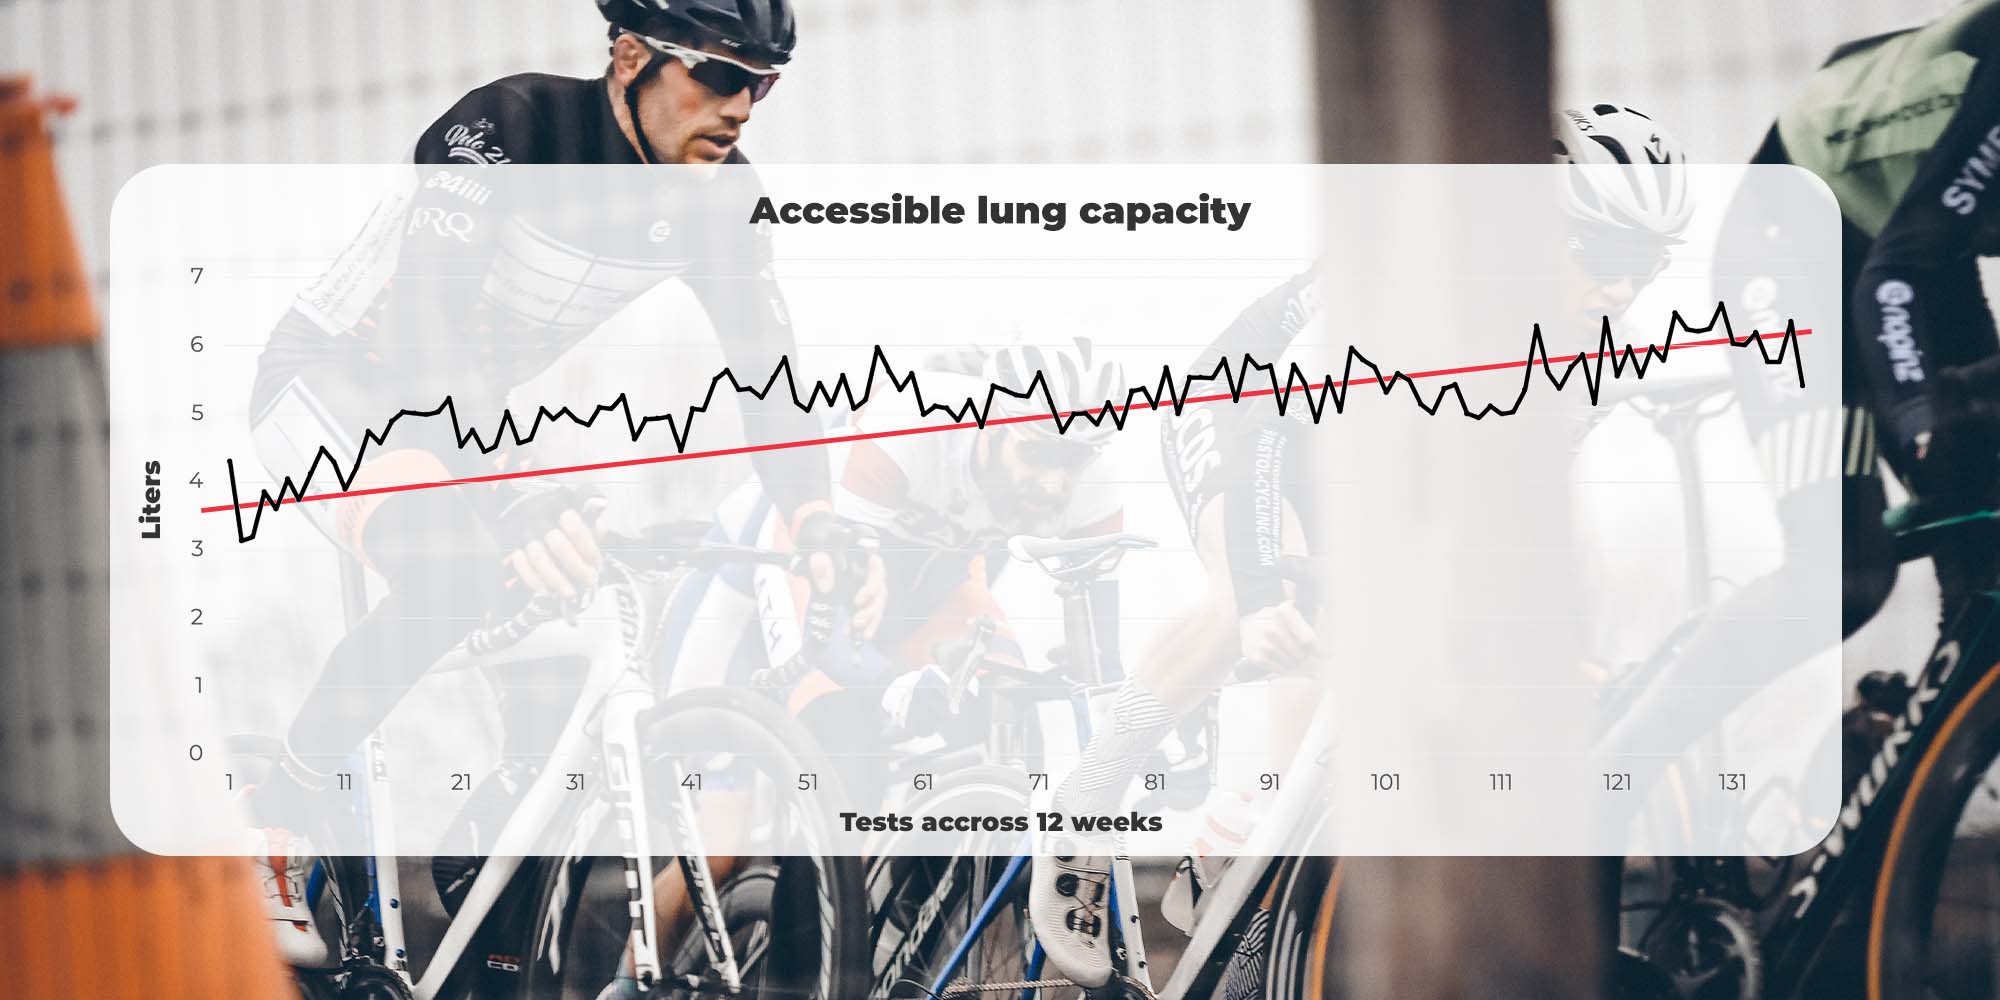
Test results showed a clear gradual increase in lung capacity, with an average weekly increase of 216.4ml per week over the 12-week period. Weeks 6-8 showed a short plateau, before then sustaining another increase. This is typical of what might be observed during any other form of training and to a certain extent, would be expected.
The tests showed that average vital lung capacity scores increased by a total of 2.38L, from just 3.69L to 6.07L. The weakest score of 3.13L was recorded during week 1, whilst the strongest score of 6.61L was recorded during the final week.
Maximal Inspiratory Pressure
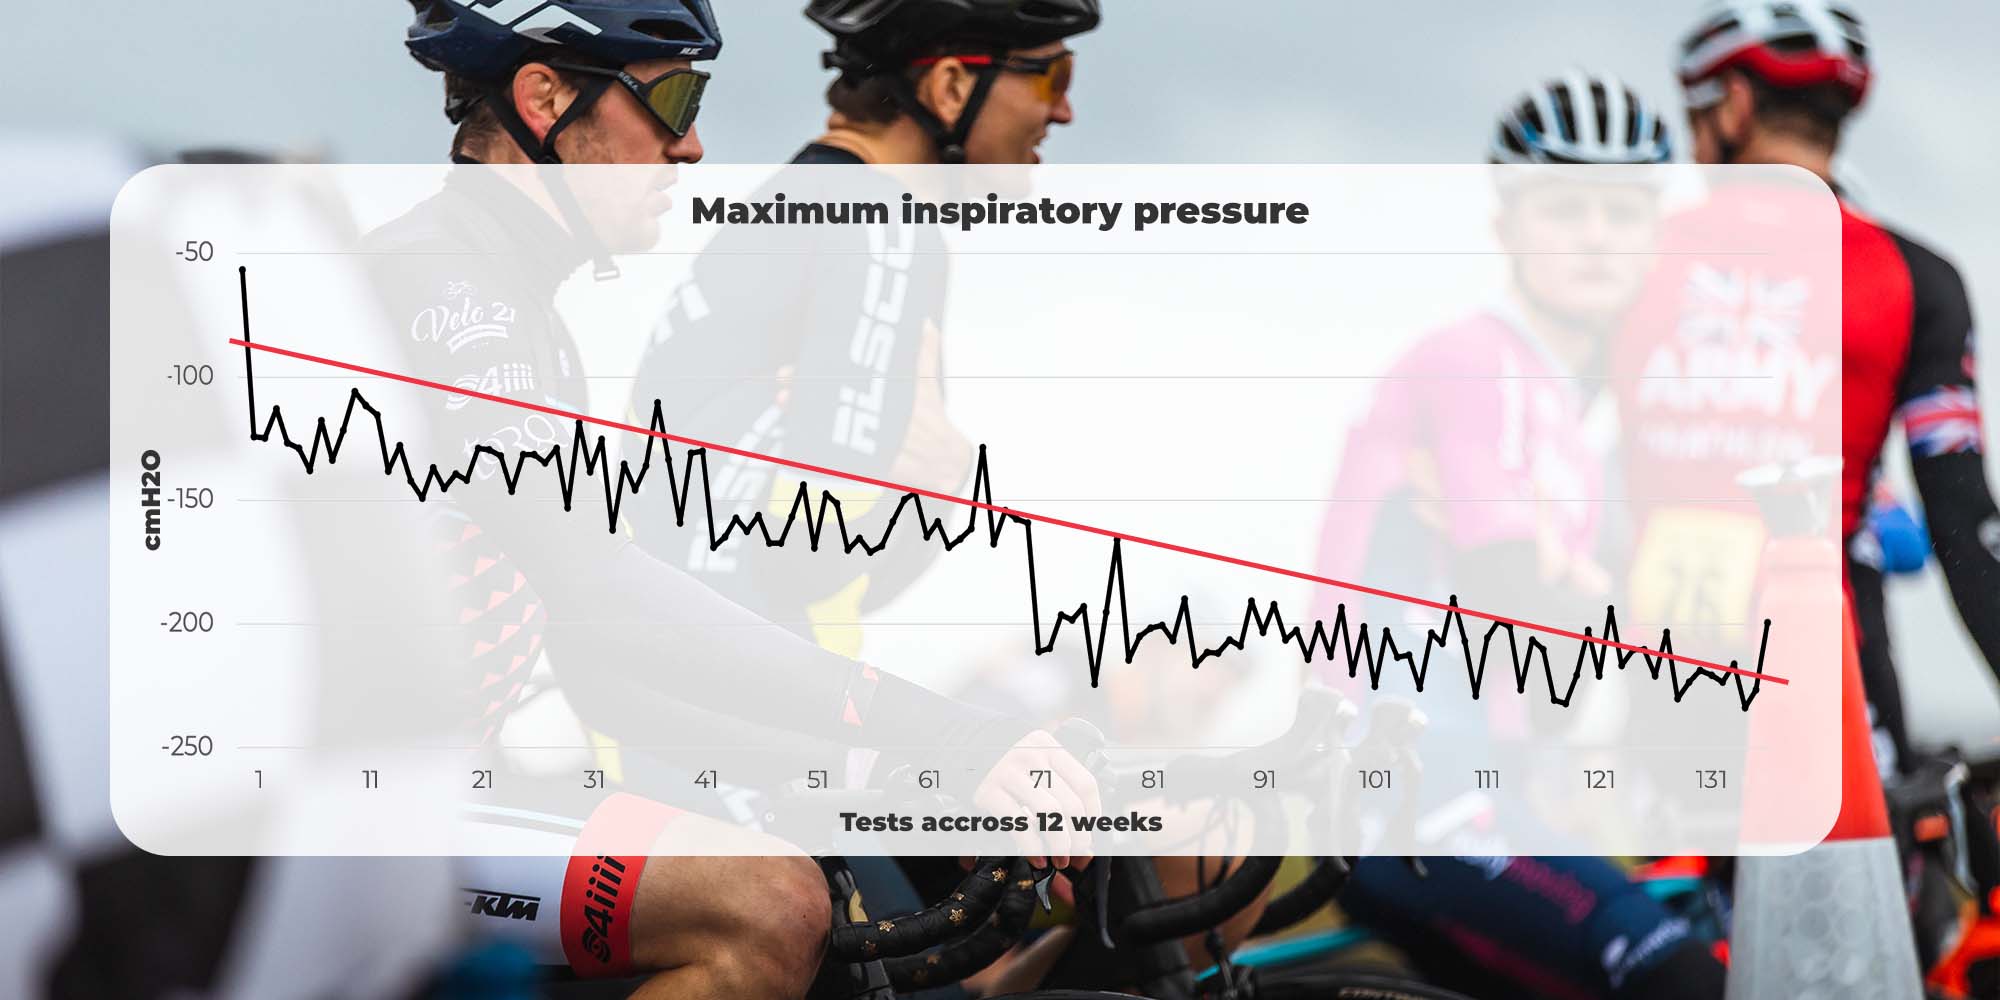
Note: Test measures negative pressure on this parameter. The lower the number, the better
Test results showed that clear adaptations were made during the 12-week period, resulting in an average weekly increase of 9.29cm H2O. Interestingly the biggest jump in scores came between weeks 7 and 8. *This may be due to a short period of not using the trainer at this point, providing the muscles with time to recover and adapt.
The weakest score of -56.64cm H2O was recorded in week 1, however this may have been a misreading due to a lack of experience of the device; the second weakest score was 111.42cm H2O. The strongest score of 323.12cm H2O was recorded during week 11.
*This short period of missed training and testing was due to a technical issue, with an old version of the breathing trainer. This was immediately replaced with an updated version.
Maximal Expiratory Pressure
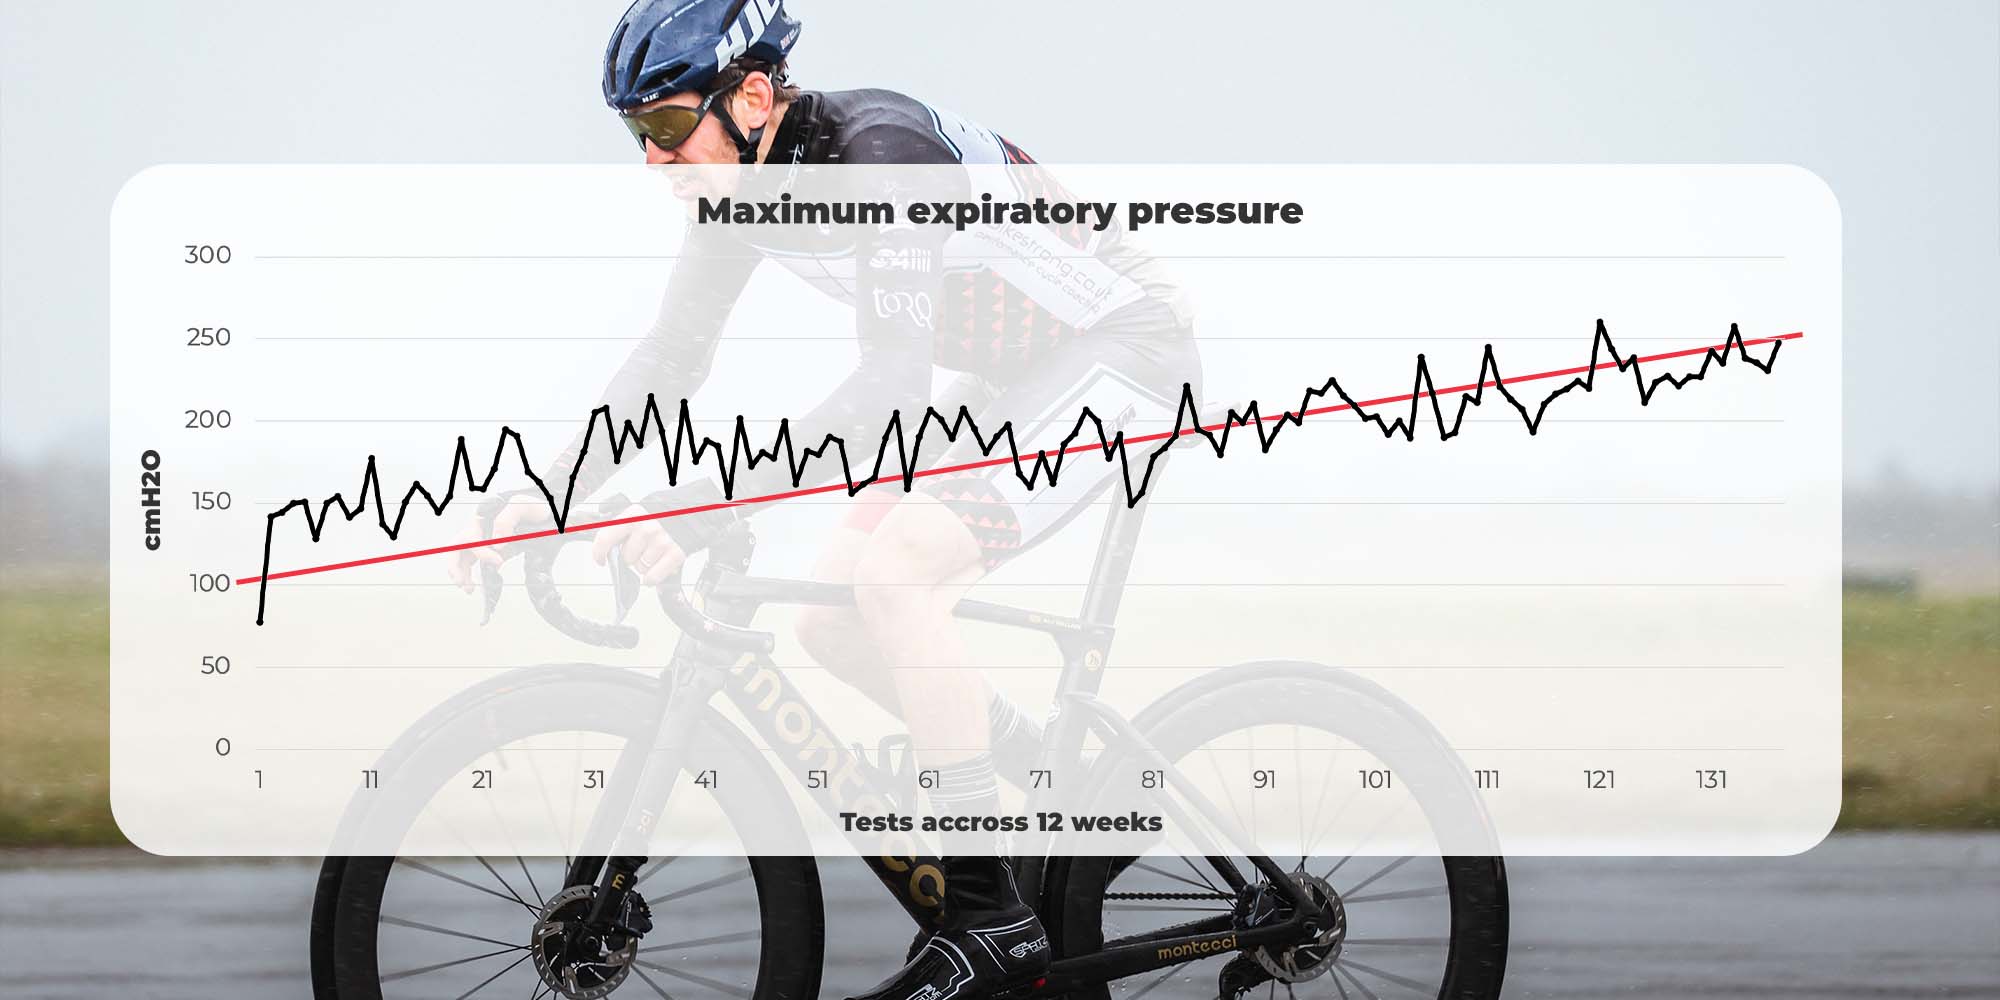
Test results showed that clear adaptations were made during the 12-week period, resulting in an average weekly increase of 8.96cm H2O. This improvement rate was consistent and showed no irregular patterns of improvement.
The weakest score of 77.19cm H2O was recorded during weak one, however again this may have been an anomaly or a misreading due to a lack of experience of the device; the second weakest score was 128.29cm H2O. The strongest score of 260.14cm H2O was recorded in the 11th week.
Note: The strongest scores being recorded during the 11th week may be a reflection of the difference in training intensity whilst cycling over these two weeks.
3. Power Data
Short term adaptations – Weeks 1-4
The most notable increase came after just one week. During a race, the previous maximum 20-minute power output (tested on day 1 of the program) was matched for 40 minutes. This may be attributed to both improved breathing technique and initial muscle activation – in the same way as you would often see fast adaptations in during the initial stage of a strength program, should the subject have not undertaken previous strength training.
Long term adaptations – Week 4 onwards
Key adaptations came over a long-term period. At the end of the 12-week training block, the 20-minute power test was repeated, resulting in a 9% increase. Greater adaptations were then made in the following months after the 12-week test period. This progress was made at a far higher rate than observed prior to undertaking any form of breathing training.
The assumption is that the breathing exercises essentially facilitated a higher quality of physical training, enabling both quicker respiratory recovery rates, during higher intensity interval training and stronger, more stable breathing during aerobic efforts. This elevated level of training quality essentially allowed for a greater “investment” into long term fitness.
4. Heart rate data
Through this training period heart rate data remained relatively consistent. It proved difficult to pinpoint exact adaptations in this area, due to the variables which effect heart rate; such as temperature and hydration. However, with that being said, periods of time achievable within both Threshold and Aerobic Capacity heart rate zones increased – with a 6bpm increase for a 20-minute period. On average there was a 5 beats per minute (BPM) increase within both of these heart rate zones. Maximum recorded heart rate also increased, whilst a resting heart rate reduced by 3-5bpm on average; resulting in a greater heart rate “range”.
5. Personal observations (feel)
Short high intensity efforts < 5 minutes
Typically, this type of effort which would result in asthmatic symptoms, such as breathlessness and wheezing. These efforts would often take almost as long to recover from and return to regular breathing, as the effort itself. By the end of the 12-week period, a far higher level of intensity was able to be maintained throughout these shorter periods. This type of effort now rarely resulted in any asthmatic symptoms and if symptoms were to occur, they were far more easily controlled, and a regular breathing rate was recovered within a far shorter time frame.
Medium steady state efforts 5 to 30 minutes
Prior to the test period this length of effort would typically be controllable, but effort levels would often be limited in order to keep breathing under control. Essentially performance was limited by breathing limitations, not strength endurance or physical capabilities. Following the 12-week test period, this ceiling had been lifted. 5 to 30 minute efforts would rarely result in any breathing difficulty and should any occur, both the power and heart rate data would typically indicate that physical ability was maximised before being reaching its limit.
Long duration aerobic efforts > 30 minutes
Long efforts improved noticeably due to improved breathing technique, effectively engaging the diaphragm whilst maintaining consistent, steady breaths. This facilitated maximum oxygen intake and effective carbon dioxide exhalation. Resulting in a higher level of performance, maintained for longer periods of time.
Overall
Breathing felt stronger and of a better quality, resulting in more control. This meant that the limiting factor when performing a maximal efforts was now physical capability, as opposed to being restricted by respiratory limitations.
6. Other observations
Psychological benefits
There was a clear phycological benefit from using the breathing trainer. The combination of two elements, taking 5 to 10 minutes away from life’s distractions and regulated deep breathing. Deep breathing can result in signals being sent to your brain, which encourages a sense of calm and relaxation. Using the Airofit breathing trainer first thing in the morning proved to be a great way to start the day, whilst an evening session gave an excellent opportunity to reflect & reset.
Digestion
An area of unexpected benefit was digestion. This was most notable in the evening following a meal. This may be attributed to the relaxation response, caused as a result of deep breathing. Any indigestion like symptoms were regularly eased or mitigated following 5 – 10 minutes use of the breathing trainer. As you would expect, some sessions were of more benefit to digestion than others.
Breathing awareness – shallow breathing
Using the breathing trainer certainly heightens awareness of breathing quality, during the day, whilst not using the trainer. This was most noticeable whilst working, seated at a computer, where shallow breathing is an easy habit to fall into. Shallow breathing can also attribute towards negative psychological effects.
Placebo?
This was mostly notable when competing. Knowing that the breathing trainer had provided a competitive edge over the opposition gave added confidence. The breathing trainer also allows you to prime your respiratory system by completing an “Instant Performance: Power” session, thus providing further added confidence that the respiratory system is primed and ready to support the rest of your body, in order to compete at its highest possible level.
Conclusion
Test data from all areas of observation showed positive results, these in turn imposed benefits to both fitness levels and an overall level of wellness.
Breathing training undoubtable improved respiratory quality and vastly relived symptoms of Exercise-Induced Asthma, whilst engaging in physical exercise. This resulted in heightened performance, which in turn facilitated an elevated level of training quality. The combination of these elements resulted in a greater trajectory of progression, evident when comparing data recorded prior to the supplementation of regular breathing training, using an Airofit breathing trainer.